Monitoring Service Calls
To monitor service calls:
- Select Service calls from the Left Area
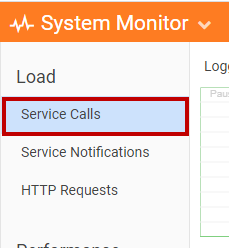
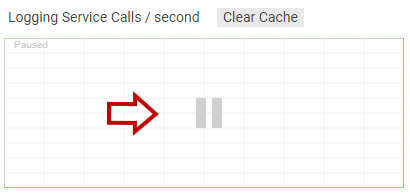
- Click on the respective service call graph to start monitoring system wide service calls made per second
Service call Options
Clear Cache: Click on the "Clear Cache" button to clear cached data on the service side. Please note that the cached data is automatically updated every few minutes.
Deadlock Info: Click on the "Deadlock Info" button to view the amount of database deadlocks during workflow service calls (and which calls where aborted from the SQL server transaction manager). Please note that the number does not mean that a call failed as there is also a retry mechanism, it only represents the amount of conflict occurred.
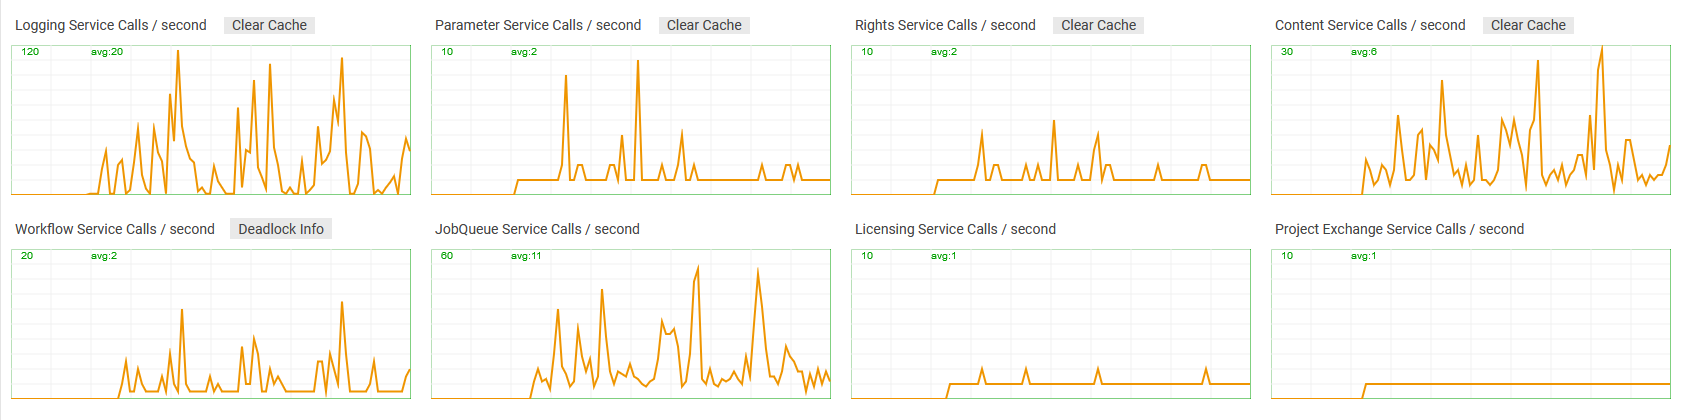
A graph represents data from current time up to last 100 secs. Each of its 10 horizontal blocks represents 10 secs in timeline.