
Breakpoints can be used to interrupt workflow execution and inspect activity variables and arguments.
A breakpoint is visualized in the designer with a striped, red circle on the top left side of an activity.
A yellow border visualizes the activity that is currently executed.
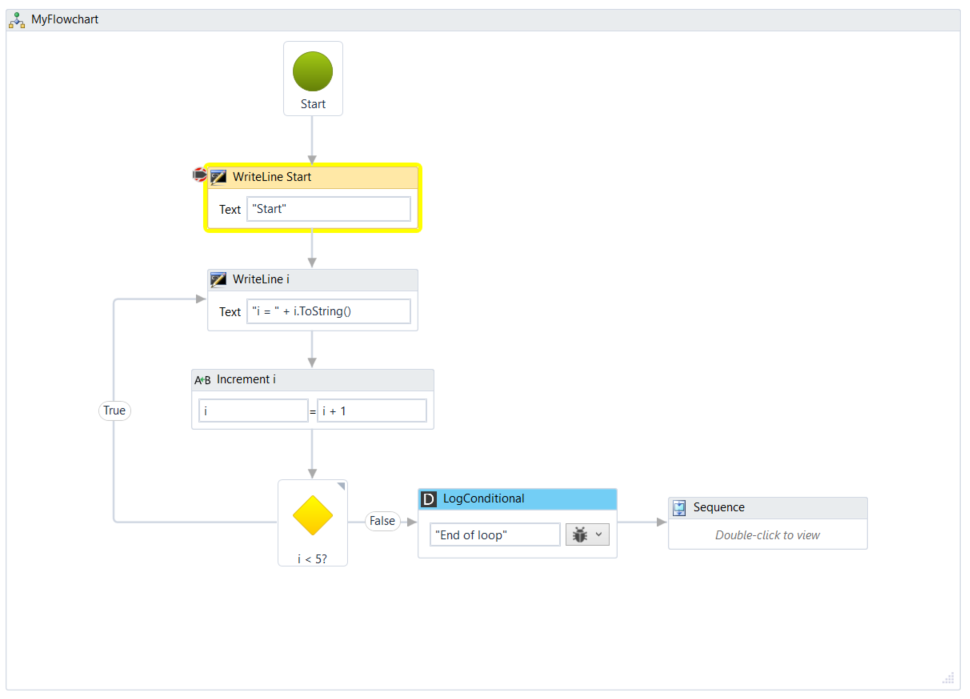
Insert a Breakpoint
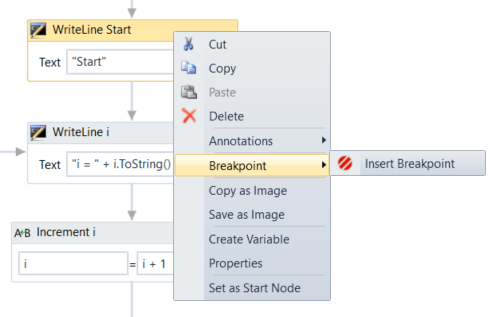
Use the context menu of an activity to insert a breakpoint or press F9 on a selected activity to toggle a breakpoint.
Delete a Breakpoint
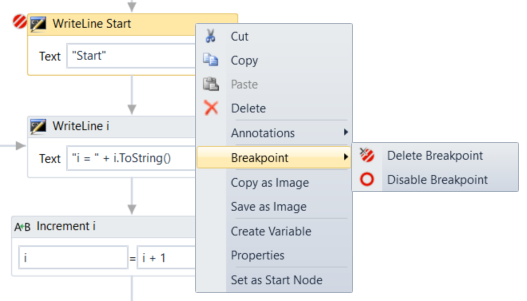
Use the context menu of an activity to delete a breakpoint or press F9 on a selected activity to toggle a breakpoint.
Run to next breakpoint
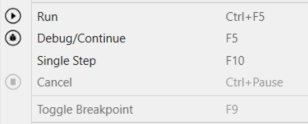
Click on the Debug/Continue toolbar button or use the main menu or press F5 to start (or continue a running) workflow to the next breakpoint (or to the end).
Ctrl-F5 will start a workflow without stopping at breakpoints.
Single-Step
Use F10 to single-step through a workflow.
Navigation from Tracking
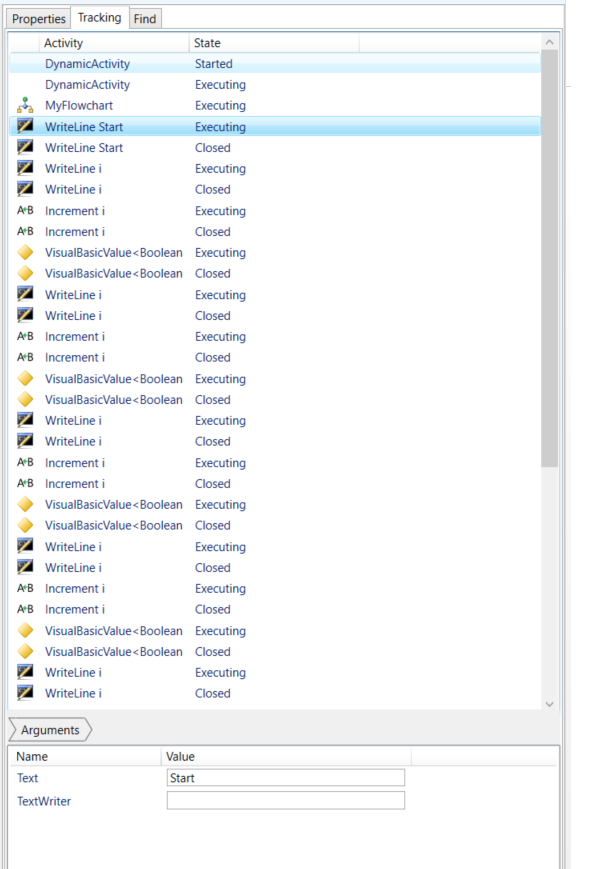
Double-click an item in the tracking list to jump to the related activity in the designer.
This will not change the currently executed location but allows to inspect values of different execution steps.
Property Inspector
Use the property inspector on the bottom of the tracking view to see the names and values of Variables and Arguments for a tracked activity.
Note: Values cannot be changed for a tracked activity.
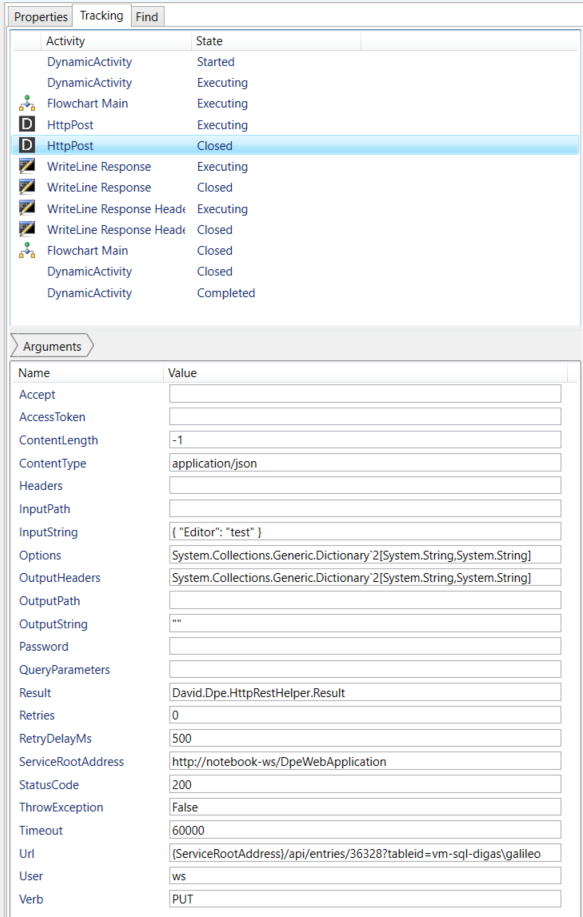
Double-click on a property name to drill into the content:
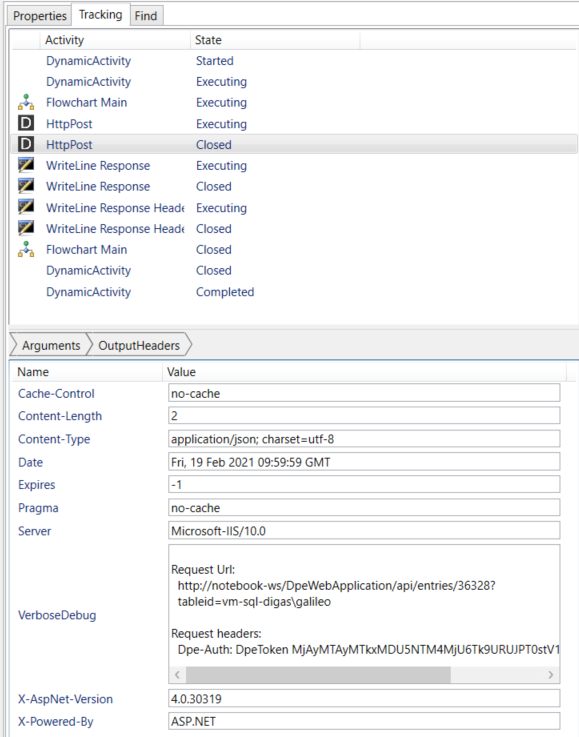
Use the breadcrumb to navigate back to objects.