Find the root cause for application crashes which are related to memory leaks.
Perfmon
Perfmon (Performance Monitor) has no significant impact on the process to be investigated and the system. Therefore it is the right tool for long monitoring periods.
Monitoring Tools
-
On the computer where the leaking application is currently running
-
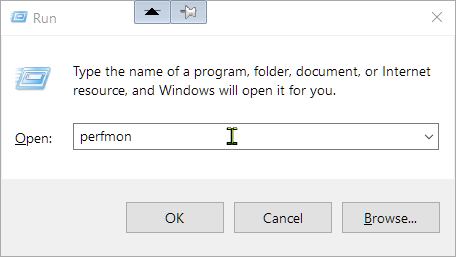
Press Windows + R Keys to open the Run dialog
-
Type perfmon to start Performance Monitor
-
Select Performance>Monitoring Tools>Performance Monitor
-
Click the red cross icon to delete the CPU counter
-
Click the green Plus icon to Add counters
-
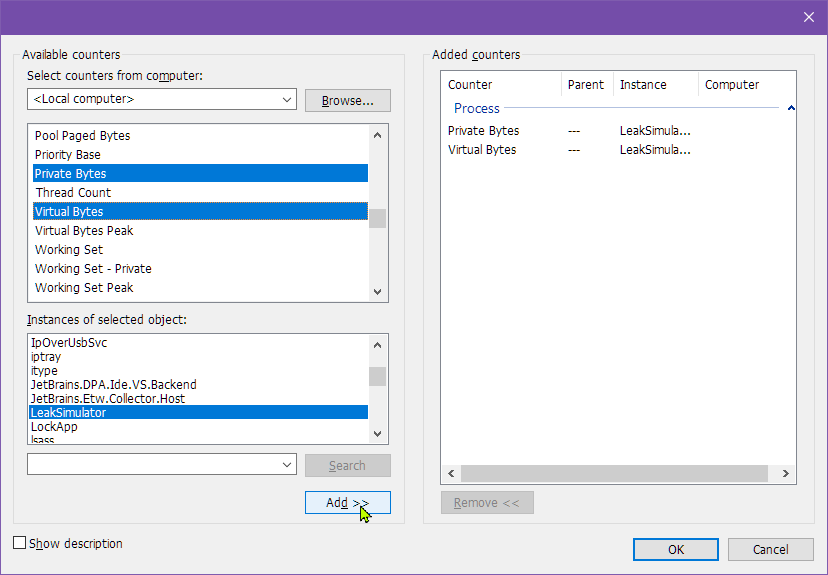
In the upper Available counters list box select and expand the Process drop-down
-
Select Private Bytes and Virtual Bytes (hold the Ctrl key and left click for multi selection)
-
In the lower Instances of selected object list box the process which should be monitored
-
Click Add>> button to add the counters to the Added counters list box
-
Confirm with OK
-
In the overview select both counters right click and click Properties...
-
On the Data tab Choose for Scale > 0,000'000'1 .
-
On the General tab Choose for Graph elements>Sample every ... seconds and Duration ... seconds the range you want to investigate.
-
Start with smaller values first e.g. (Sample 10s, Duration 1000s) and increase it later to e.g. (Sample 60s, Duration 86400s)
-
Let it run
-
If either the private bytes or the virtual bytes increase overtime without going back memory consumption has to be investigated further. E.g. Check the log files what happened at the time points when the memory increases.
Data Collector Sets
-
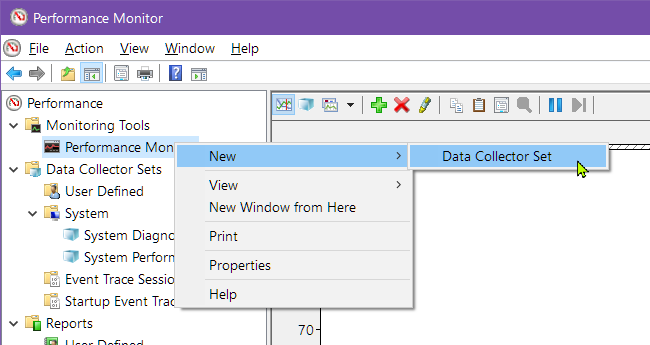
Right click on Performance>Monitoring Tools>Performance Monitor to open the context menu
-
Select New>Data Collector Set
-
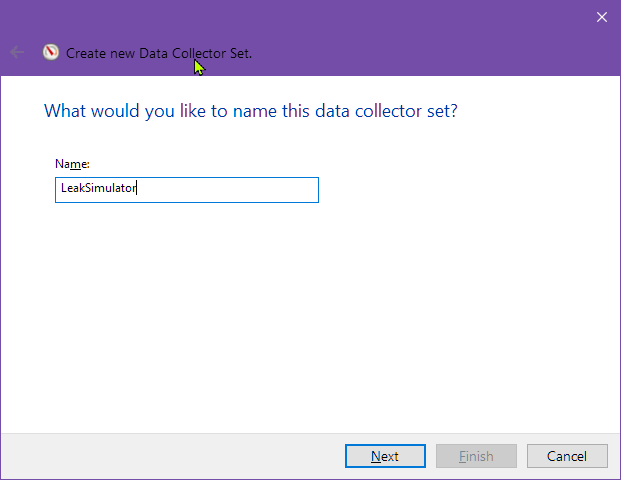
On the dialog Create new Data Collector set the Name to LeakSimulator
-
Click Next
-
Click Finish
-
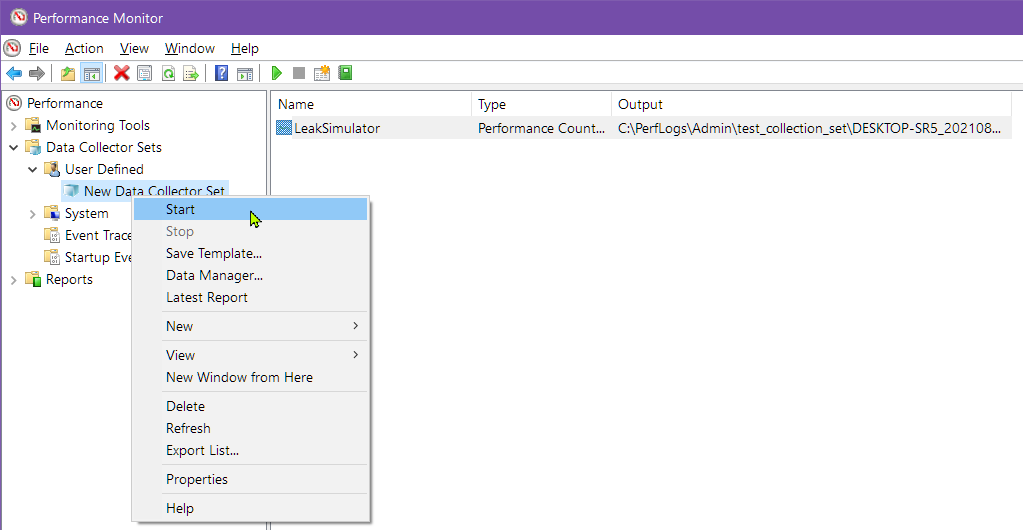
Right click on Performance>Data Collector Sets>User Defined>New Data Collector Set to open the context menu
-
Select Start
-
Let it run
-
After some time right click on Performance>Data Collector Sets>User Defined>New Data Collector Set to open the context menu
-
Select Stop
-
The default report location is C:\PerfLogs\Admin\<Application Name>\System Monitoring Log.blg
Info: to use the Process ID you can set this registry Value: Computer\HKEY_LOCAL_MACHINE\SYSTEM\CurrentControlSet\Services\PerfProc\Performance\ProcessNameFormat=2 (DWORD)