This article is about crashing Win32 applications. These are applications developed with C/C++ for the Win32 API. It is not about .NET or web applications.
In many cases, crashes of applications cannot be reproduced - especially not at DAVID. They happen only sometimes when a customer runs them. In very rare cases, the regular log files contain any useful information. This cannot be expected, because for performance reasons, writing to log files is normally buffered in memory and when an application crashes, the last seconds, which are only in buffer, are typically missing in the log file. Aside of this general problem, a regular log file would need to be extremely verbose and would have to contain tons of internal details of every operation, in order to possibly have enough information about a crash. But we have different means to create useful information, nevertheless:
DigaSQL StackDump
The first one is a stack dump written by DigaSQL.dll. Each module using this dll can make use of a function to write a stack dump (some modules use it, others don't). The administrator needs to activate it, too, by entering a value in the DigaSystem registry in "Protocol\DigAS-StackDump". If an application uses the DigaSQL function and if everything works out well, such a stack dump is being written when an application has an exception. This need not be a final crash. An application can catch exceptions and can act accordingly to the severity of each exception. Therefore, sometimes you get stack dumps only as additional information for a problem, but the application continued running.
A stack dump written by the DigaSQL is only a pure text file. You can (and should) have a look into them with a text editor. Here is an abbreviated example:
********************************************************************
DigaSystem  Stack dump
Windows:    Windows Server 2008
Station:    FH-KLTP010
Program:    DAVID Systems TurboPlayer 5.9_Pro_0x00030090
User:       KLTP010
Time:       2020-11-23 21:04:53.143
Process ID: 00001CBC (7356)
Thread ID:  00000554 (1364)

Windows exception E06D7363: Microsoft C++ exception
Address: 74E4C5AF 01:0000B5AF C:\Windows\syswow64\KERNELBASE.dll

Registers:
EAX:0018F8F8  ECX:00000003
EBX:0018F99C  EDX:00000000
ESI:00B2D080  EDI:00C069CC
CS:EIP:0023:74E4C5AF
SS:ESP:002B:0018F8F8  EBP:0018F948
DS:002B  ES:002B  FS:0053  GS:002B
Flags:00000212

Loaded modules:
C:\Program Files (x86)\DigaSystem\TurboPlayer.exe   Version: 5.9.2354.0 LinkTime: 2020-04-29 17:35:00 BaseAddress: 00400000
C:\Windows\SysWOW64\ntdll.dll   Version: 6.1.7600.16385 (win7_rtm.090713-1255) LinkTime: 2019-04-19 03:51:58 BaseAddress: 771C0000
.....

Intel call stack:
Address   Frame     Logical addr  Module
74E4C5AF  0018F948  0001:0000B5AF C:\Windows\syswow64\KERNELBASE.dll
00958BE2  0018F98C  0001:00557BE2 C:\Program Files (x86)\DigaSystem\TurboPlayer.exe
00955536  0018F9A8  0001:00554536 C:\Program Files (x86)\DigaSystem\TurboPlayer.exe
....
771F97D5  0018FFEC  0001:000297D5 C:\Windows\SysWOW64\ntdll.dll

Symbol call stack:
Address   Frame     Logical addr   Symbol [File/Module]
74E4C5AF  0018F948  0001:0000B5AF  RaiseException+58 [C:\Windows\syswow64\KERNELBASE.dll] Params: E06D7363 00000001 00000003 0018F980
00958BE2  0018F98C  0001:00557BE2  <symbol not found> [C:\Program Files (x86)\DigaSystem\TurboPlayer.exe] Params: 0018F99C 00C069CC 00B2ADB0 16B416F0
.....
771F97D5  0018FFEC  0001:000297D5  RtlInitializeExceptionChain+36 [C:\Windows\SysWOW64\ntdll.dll] Params: 00953628 7EFDE000 00000000 78746341
End of DigaSystem stack dump
Even if you are no developer, you can read out useful information and make a basic check, whether the stack dump is valid.
-
The first block lists information about the operating system, the computer name, the crashed process and the time of the crash.
-
The second block tells us what exception occurred. In this case it was a MS C++ exception. There might be some additional information, which is normally only interesting for the developer of the module.
-
These are the CPU register values when the crashed occurred. Only interesting for the developer and only for some very special analyze techniques.
-
The block "Loaded modules" lists all loaded modules (the main application and all loaded libraries). This is interesting for non-developers, too, because here you can find the version numbers and the build date/time of all modules.
-
The Intel call stack can quickly be checked by a non-developer. If it is super short (e.g. containing only a single or 2-3 lines), it is defect and is not usable. The same is the case if the addresses are obviously nonsense (e.g. only the address 00000000). One additional thing you can read out as non-developer are the affected modules. Typically, the main application always occurs somewhere in the stack. But sometimes you have also other modules, e.g. MultiRec or DigaSQL. This is a strong hint that these modules might be responsible for / involved in the crash and you can consider sending analyze requests to the corresponding developers, too.
-
The Symbol call stack is normally only a copy of the Intel call stack with some different detail information. For a non-developer it does not help more than the Intel call stack. It is only interesting, if only one of the two stacks seems to be defect, while the other seems to be o.k. In this case it is worth trying an analysis of the stack dump.
SXL/UXL files
Some of our modules can write a file with extension SXL or UXL. Typically, this cannot be configured and it is done automatically to a non-configurable directory. Possible locations for this directory are:
-
The directory, where the main application is located,
-
the current working directory,
-
or one of the roots of these directories - which is something like C:\
The SXL/UXL files are similar to a DigaSQL stack dump. They do not contain the list of loaded modules and are therefore inferior. Writing these files was implemented earlier than the implementation of the DigaSQL stack dump writing and it competes with the DigaSQL writing. Therefore, you might get these files with some old modules if the problem occurs within them. In case of a crash it is useful to look into the mentioned directories, whether an SXL or UXL file is present.
MiniDump files
A mini dump file is an invention by Microsoft. It contains a part of the memory of a process, which is being written to a file in a special format. Such a file can be opened by some Microsoft tools like DumpChk, WinDbg or VisualStudio and can be used for analyzing the state of a process at a certain point in time (in this case at the time of a crash).
"Mini" can be read literally. Only a very small part of the memory of the process is normally written. This part is chosen by Windows when writing the dump file. In case of a crash Windows picks only some information around the crashing thread and some local variables on the stack. This might be enough to analyze a problem, but very often it is not. Therefore, a bigger part of the memory of the process can be written. The biggest possible part is to write all the memory of a process to the dump file. This is still called a "Mini dump", because it uses the same file format, but it will take much longer to write such a file and the file will be much bigger. Typically you can expect some ten seconds for writing and many 100 MBytes of file size. This might be undesirable, especially, because you cannot restart the crashing process as long as the dump is being written. On the other hand, the full dump contains a lot more information, which can help to find a problem. A possible recommendation is to start with a mini dump and if the resulting dump does not contain enough information, try with a full dump in the next step.
MiniDump via DigaSQL
DigaSQL has the possibility to create a mini dump file for a crashing process. Therefore, the administrator needs to configure the DigaSystem registry values "Protocol\MiniDumpLevel". Here are the possible values.
-
0: No mini dumps are written -> 0 Bytes
-
1: Mini dump contains only minimal information (stack, local variables) -> ~100 kByte
-
2: In addition mini dump contains global variables, handles and thread data -> ~1 MByte
-
3: In addition mini dump contains a full memory dump -> ~100 MByte or more
The dumps are written to the path which is specified with the "Digas-StackDump" protocol destination and with each crash a new file is created.
Unfortunately, you will notice that in most cases writing a mini dump by DigaSQL will not work. Reason is that it is very unlikely that an application itself can gather all the necessary information and write it to a file, if it is already in the process of crashing/being terminated by Windows. Therefore, creating useful mini dump files normally requires an external application, which monitors the crashing application and which is able to create a mini dump while running stable. There are multiple tools to do this. (Hint: on a user request it is even possible with the Windows Task Manager by right-clicking on a process in the details view and selecting the menu command to create a mini dump).
MiniDump via Windows Error Reporting (WER)
Windows has everything available to directly generate a dump file when an application crashes.
To prepare the generation of dump files open RegEdit and navigate to:
HKLM\Software\Microsoft\Windows\Windows Error Reporting
This key should always be available. The subkey "LocalDumps" might be available or not. If it is not available, create this subkey. Enter the following values:
-
DumpFolder (REG_SZ): The folder where to put the create dump files.
-
DumpCount (REG_DWORD): The number of dump files to keep before Windows deletes them automatically.
-
DumpType (REG_DWORD): The type of the dumps being created.
-
0: Custom dump (whatever that means...)
-
1: Mini dump
-
2: Full dump
-
-
CustomDumpFlags (REG_DWORD): This value contains special flags, which control the behavior of the dump creation. Normally, don't set this value! Here are more details about the flags:
https://docs.microsoft.com/en-us/windows/win32/api/minidumpapiset/ne-minidumpapiset-minidump_type
If the subkey "LocalDumps" was not configured, it is possible that Windows has placed the dump files somewhere else (only possibly...). A good try is the folder: C:\Users\<Username>\AppData\Local\CrashDumps. You can also search the harddisk for files with extension ".dmp".
The error reporting can also be configured with individual settings for each executable. You have to add a subkey with the name of the executable below "LocalDumps". Here is an example:
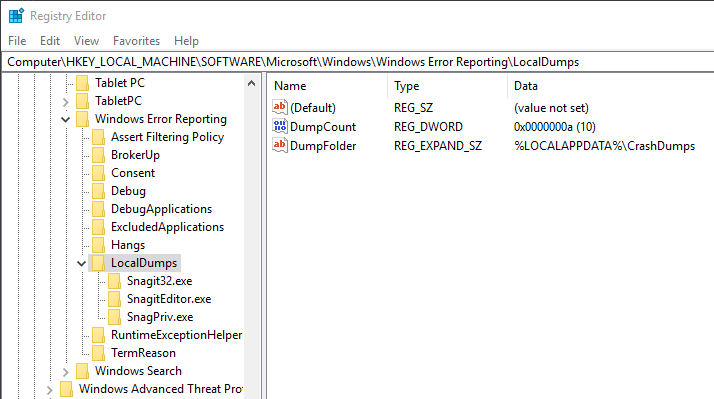
The value in "LocalDumps" are the general values, which apply to each application. Each of the possible values can appear in the per-application subkey, too.
If you want to have more information, here is a good start page from Microsoft:
https://docs.microsoft.com/en-us/windows/win32/wer/collecting-user-mode-dumps
ProcDump
This is a tool from Mark Russinovich / SysInternals and is now owned by Microsoft themselves. You can download the tool from this page:
https://docs.microsoft.com/en-us/sysinternals/downloads/procdump
It is not necessary to download other tools from the SysInternals suite.
Then you need to run ProcDump permanently in a command line window. It must monitor the application and write a dump when the application crashes.
These command line options should be used:
-
-e: Write a dump when the process encounters an unhandled exception.
-
-ma: Write a dump file with all process memory. The dump file will be as big as the application just uses memory. This tasks much longer, creates much bigger files, but analysis of the dump has much more possibilities to find the problem.
-
-mm: Creates a mini dump only. Use alternatively to -ma if writing the full dump (which can take a minute or so) is not acceptable in a productive environment. Hint: as long as a dump file is being written, it is not possible to restart the application.
-
-w: Wait for the specified process to launch if it's not running. Might be useful if you first start ProcDump and only afterwards the application.
-
Process name or process ID
Example:
procdump -e -ma TurboPlayer
As it is not nice to have a permanent command line open (and the user possibly closing it), an alternative is to enter ProcDump as general "debugger". It will not do any real debugging, but will write a mini dump file whenever an application crashes. This is called a "postmortem debugger". The advantage is that you do not need to run a command line permanently.
You need to edit the Windows registry in key:
HKLM\Software\Microsoft\Windows NT\CurrentVersions\AeDebug
There set the value "Debugger" (REG_SZ) to the command line to execute, which is:
"C:\Program Files\Sysinternals\procdump.exe" /accepteula -ma %ld C:\Dumps
Please set the path "C:\Program Files\Sysinternals\" according to the correct location of your procdump.exe. The parameter %ld acts as placeholder for the crashing process and is replaced by Windows. The location "C:\Dumps" must exist and must be writeable with regular rights (best by each user of the computer). You can also first save the original value in order to restore it after debugging. Pay attention that ProcDump will create dumps whenever an application crashes. Each dump file can be very big. Therefore monitor the dump directory.
Alternatively you can call ProcDump with the option -i as an Administrator in order to install ProcDump as postmortem debugger.