The Loudness Meter is designed to help producing audio files that are compliant to “R 128” recommendations. This meter section displays five relevant Loudness values and is available in all Audio Editors.
In all editor screens the EBU-R128 loudness meter pane can be displayed via View menu.
It can be configured in manifold ways. Here the default layout is described.
|
Item |
Description |
|---|---|
|
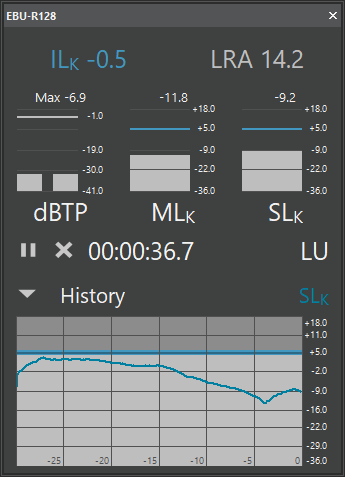
ILk |
Integrated loudness meter: Shows the loudness of the complete analyzed timeline content. |
|
LRA |
Loudness range: Shows the loudness dynamic of the analyzed timeline content (always in LU). |
|
dBTP |
True peak: Shows maximum values for each stereo channel. |
|
MLk |
Momentary loudness: Shows the current loudness value |
|
SLk |
Short term loudness: Displays an integration of loudness values over the past seconds. |
|
Start / Pause |
Start or stop current loudness integration. |
|
Reset |
Resets loudness measure incl. history. |
|
History graph |
Shows the SLk or MLk behavior of the last 30 seconds. The dark blue line at marks the Loudness target level, the light blue area around it shows the tolerance value around the target level. The display is calculated during audio playback and will be still shown when the playback is stopped. The graph is cleared either with the Reset button or by starting the audio playback again. |
Loudness Settings
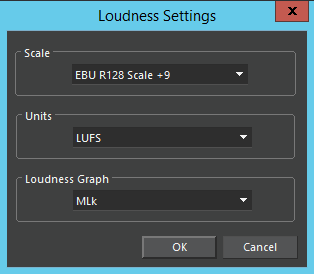
Right click inside the loudness meter to get into the loudness settings:
|
|
|
|---|---|
|
Scale |
Select if to display in EBU R128 scale +9 or scale +18. For MTE 7.5.1551.0 or above, custom scales can be selected (see below). |
|
Units |
Select if to display values as LU or LUFS. |
|
Loudness graph |
Select if to display SLk or MLk in loudness history graph. |
In MTE version 7.5.1551.0, a new feature was added that allows administrators to supply custom loudness scales among which the user can select (in addition to standard scales +9 and +18). Custom scales must be configured via the GUILoudnessCustomScale_n parameter as described in the Loudness Configuration page.
The dark blue line at marks the Loudness target level, the light blue area around it shows the tolerance value around the target level.
The display is calculated during audio playback and will be still shown when the playback is stopped. The graph is cleared either with the Reset button or by starting the audio playback again.