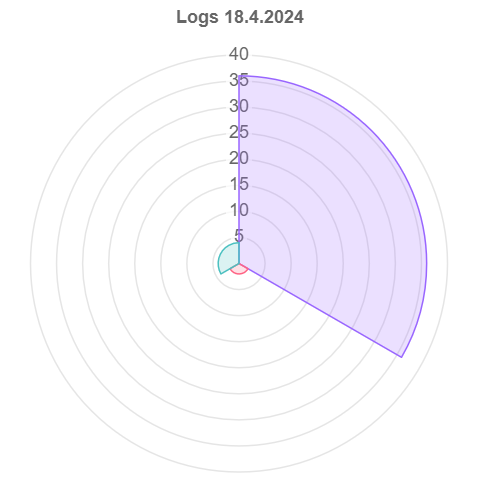
Default configuration
By default the following visualizations are configured:
Category “Logs”
-
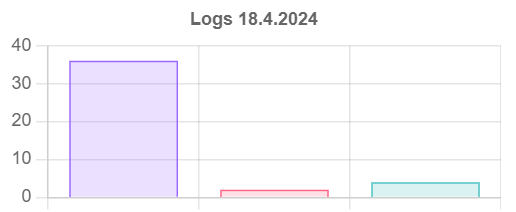
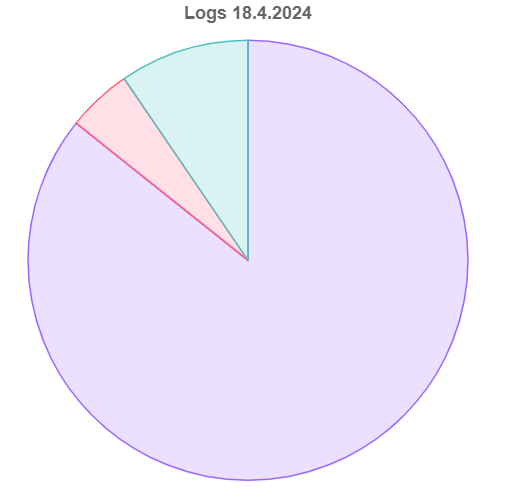
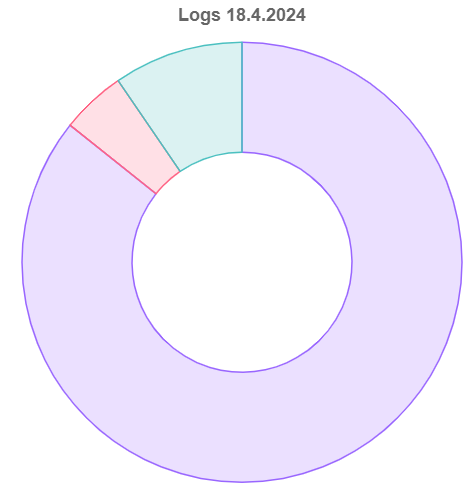
Log item count for a day grouped by log level
-
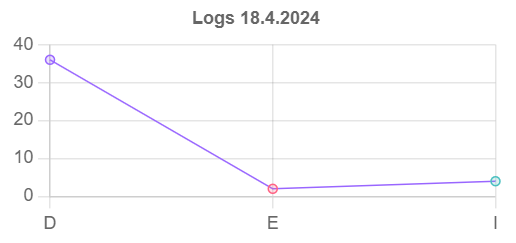
Log item count/hour for a day grouped by log level
Category “Workflows”
-
Workflow instance count for a day grouped by state
-
Worfklow instance count/hour for a day grouped by state
-
Workflow instance count/hour for a day grouped by workflow type
-
Workflow instance count for a day grouped by workflow type
-
Start delay of PreProductionAudio (in milliseconds)
Category “ContentService Deadlocks”
-
ContentService deadlock retries/hour for a day
-
ContentService deadlocks grouped by source
Customizing the configuration
Analytics is configured in the parameter folder Admin|Analytics.
Each sub folder below defines a category name, e.g. “LogsHroup”, “WorkflowsGroup”.
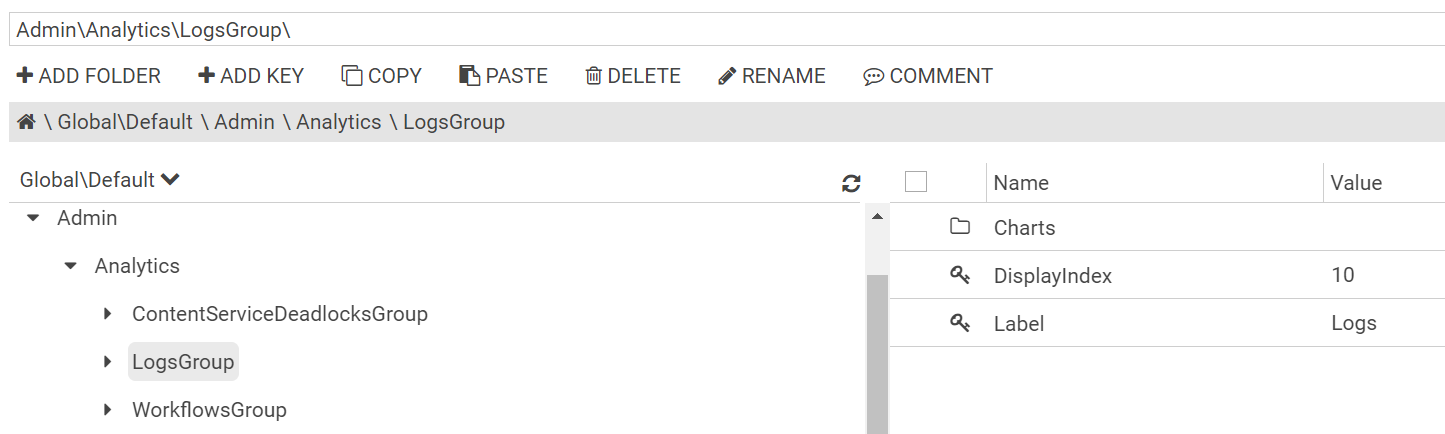
A single visualization is configured in a folder Admin|Analytics|MyCategory|Charts|MyVisualization.
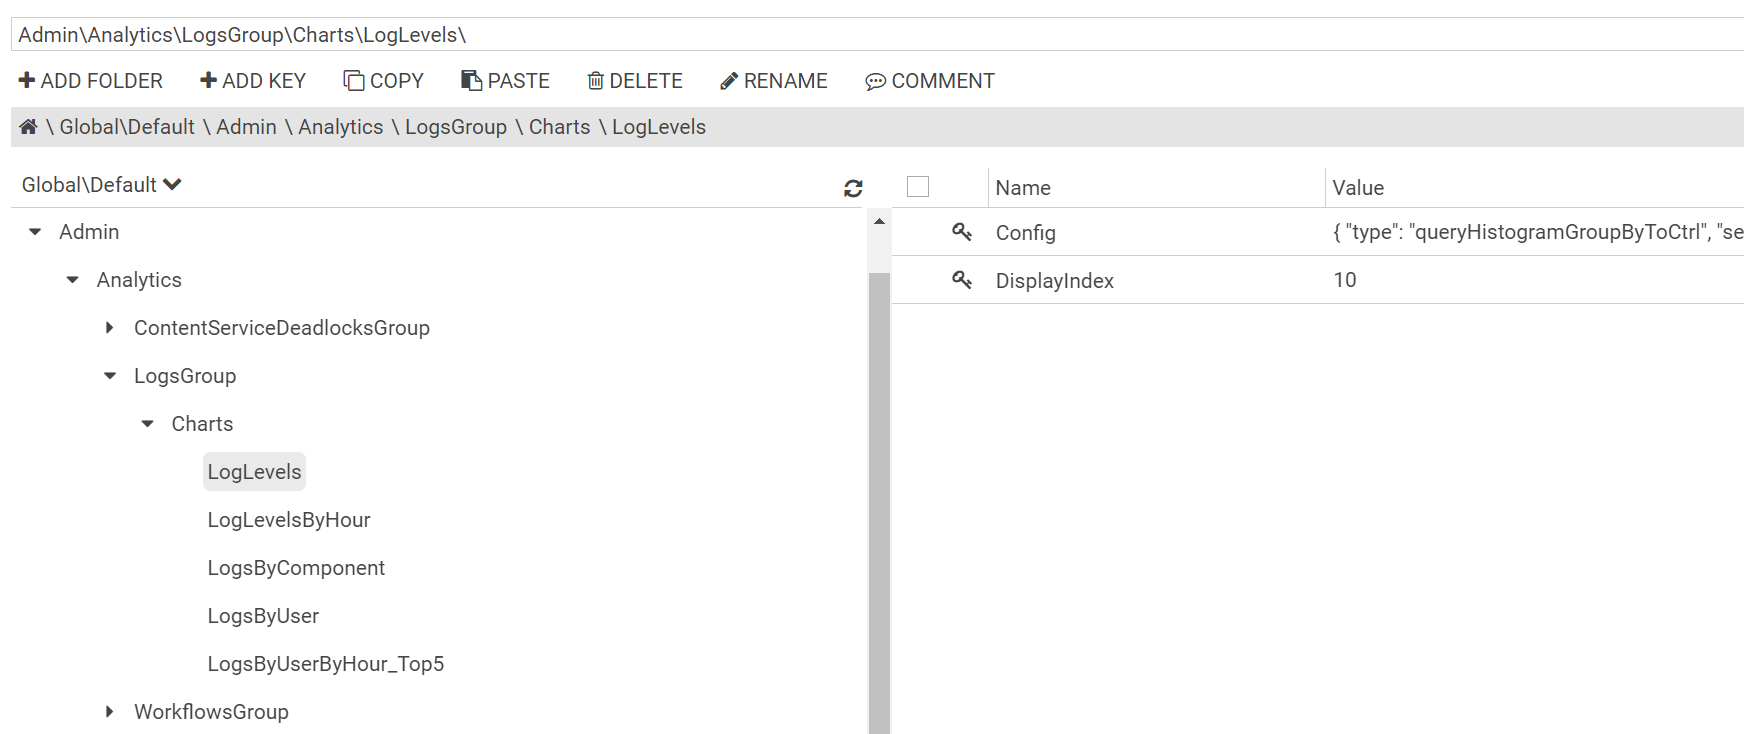
Examples
LogLevels: Log item count for a day grouped by log level
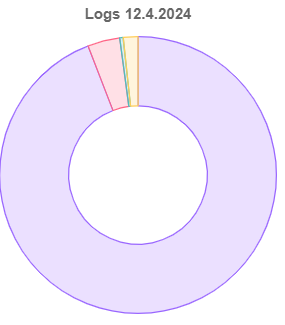
Config
{
    "type": "queryHistogramGroupByToCtrl",
    "service": "LoggingServiceProxy",
    "mode": "groupby",
    "chartType": "doughnut",
    "phrase": "Created:${day}",
    "field": "Level",
    "headline": "@Logs ${day}",
    "colorMapperCallback": "LogLevels",
    "style": "width:14%; min-width:100px;"
}
LogLevelsByHour: Log item count/hour for a day grouped by log level
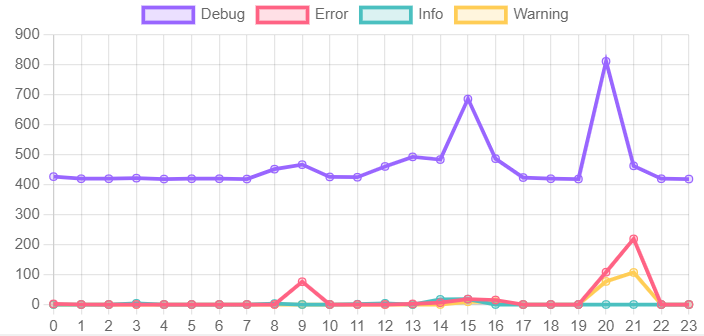
Config
{
    "type": "queryHistogramsToCtrl",
    "service": "LoggingServiceProxy",
    "mode": "day",
    "phrase": [
        "Created:${day} +Level:D",
        "Created:${day} +Level:E",
        "Created:${day} +Level:I",
        "Created:${day} +Level:W"
    ],
    "name": [
        "Debug",
        "Error",
        "Info",
        "Warning"
    ],
    "field": "Created",
    "colorMapperCallback": "LogLevels",
    "headline": "@Logs "
}
WorkflowStates: Workflow instance count for a day grouped by state
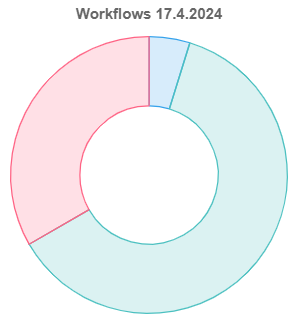
Config
{
    "type": "queryHistogramGroupByToCtrl",
    "service": "WorkflowServiceProxy",
    "mode": "groupby",
    "chartType": "doughnut",
    "phrase": "Created:${day}",
    "field": "State",
    "headline": "@Workflows ${day}",
    "colorMapperCallback": "WfStates",
    "labelAdapter": "WfStates",
    "style": "width:14%; min-width:100px;"
}
WorkflowStatesByHour: Worfklow instance count/hour for a day grouped by state
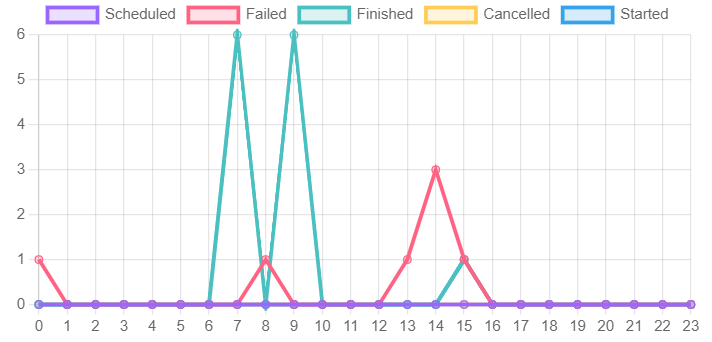
Config
{
    "type": "queryHistogramsToCtrl",
    "service": "WorkflowServiceProxy",
    "mode": "day",
    "phrase": [
        "Created:${day} +State:Scheduled",
        "Created:${day} +State:Failed",
        "Created:${day} +State:Finished",
        "Created:${day} +State:Cancelled",
        "Created:${day} +State:Started"
    ],
    "name": [
        "Scheduled",
        "Failed",
        "Finished",
        "Cancelled",
        "Started"
    ],
    "field": "Created",
    "_slotsize": 900,
    "colorMapperCallback": "WfStates",
    "headline": "Workflows "
}
WorkflowsByHour: Workflow instance count/hour for a day grouped by workflow type
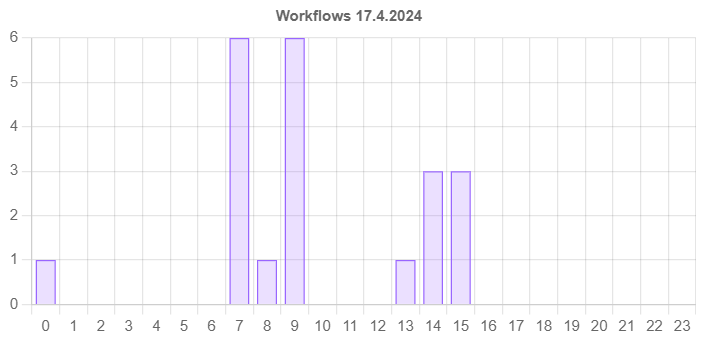
Config
{
    "type": "queryHistogramToCtrl",
    "service": "WorkflowServiceProxy",
    "mode": "day",
    "phrase": "Created:${day}",
    "field": "Created",
    "headline": "@Workflows ${day} "
}
WorkflowTypesByHour_TopN: Workflow instance count/hour for a day grouped by workflow type (only show top N)
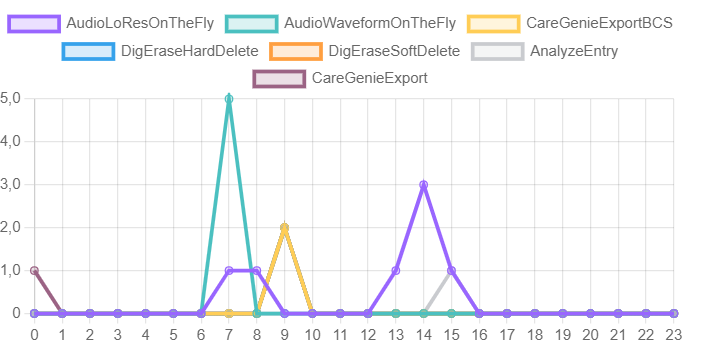
Config
{
    "type": "queryTopHistogramsToCtrl",
    "service": "WorkflowServiceProxy",
    "mode": "day",
    "phrase": "Created:${day}",
    "field": "Created",
    "topField": "WorkflowType",
    "topCount": 7,
    "headline": "Workflows "
}
WorkflowsByType: Workflow instance count for a day grouped by workflow type
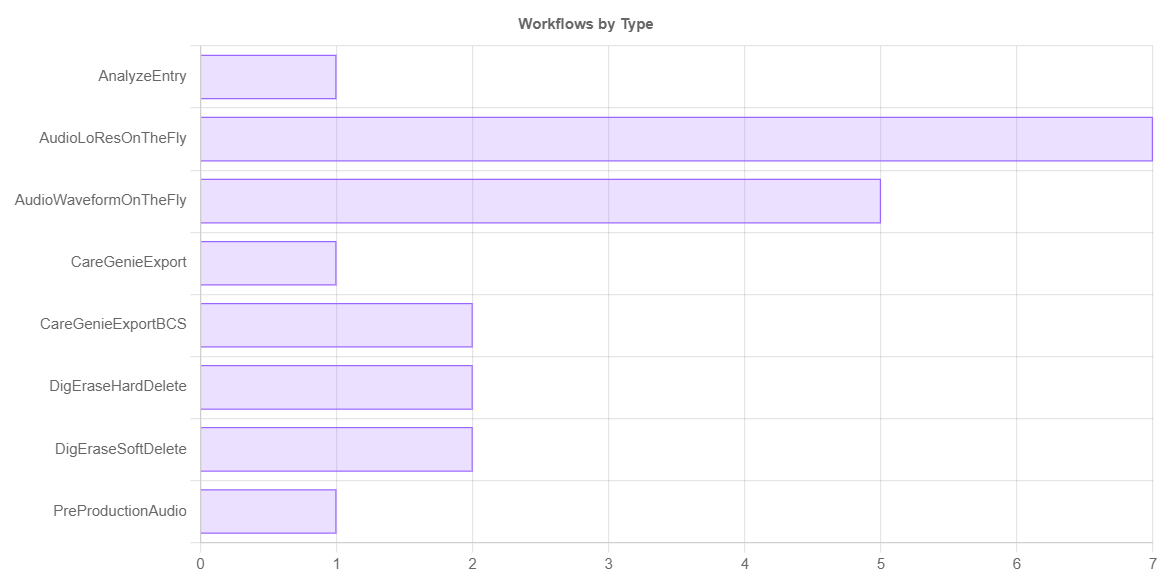
Config
{
    "type": "queryHistogramGroupByToCtrl_Callbacks",
    "service": "WorkflowServiceProxy",
    "mode": "groupby",
    "phrase": "Created:${day}",
    "field": "WorkflowType",
    "headline": "@Workflows by Type",
    "colorMapperCallback": ["rgba(153, 102, 255, 0.2)", "rgb(153, 102, 255)"],
    "_1configCallback": "indexAxis=y|scales.x.type=logarithmic",
    "_2configCallback": "scales.y.type=logarithmic",
    "configCallback": "indexAxis=y",
    "style": "width:50%"
}
WorkflowsStartDelay_PreProductionAudio: Start delay of PreProductionAudio
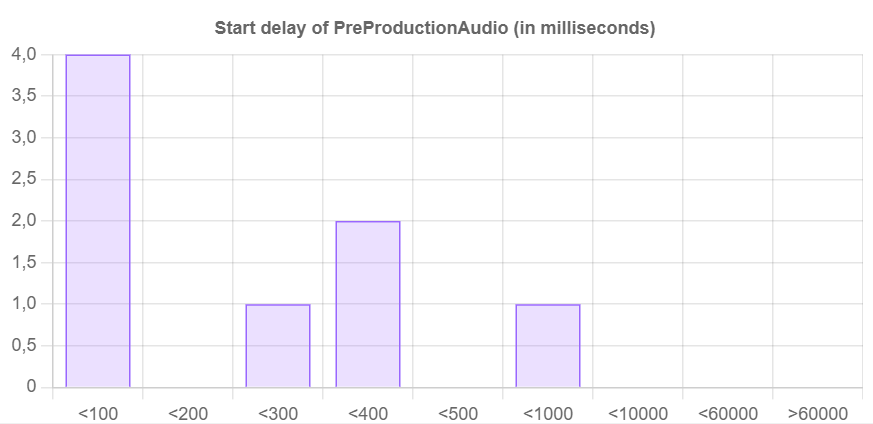
Config
{
    "type": "queryHistogramGroupByToCtrl",
    "service": "WorkflowServiceProxy",
    "mode": "groupby",
    "phrase": "Created:${day} +State:Finished +WorkflowType:PreProductionAudio",
    "field": "DATEDIFF(MS,Created,Started)",
    "headline": "@Start delay of PreProductionAudio (in milliseconds)",
    "dataAdapter": "compress",
    "style": "width:50%"
}
JSON Config Description
|
Name |
Description |
|---|---|
|
service |
Specifies the service to query for data
|
|
type |
Specifies the algorithm how the data is processed for visualization
|
|
mode |
|
|
slotsize |
Only used in mode “day”, specifies the granularity, default: 3600 (= 1hour) |
|
phrase |
Parameterized search phrase or array of search phrases Example: Example: |
|
field |
Selected data field name (or query) for visualization Example (for mode groupby): Example (for mode day): Example: |
|
chartType |
Only used for mode “groupby”
|
|
headline |
Optionally show a headline Example: |
|
style |
Apply styling to visualization widget Example: |